1. Simple fluid displacement without dispersion
Consider the lowly pipe. Unless it is clogged or leaks, what comes in goes out. This is mass balance--nothing lost, nothing gained. Fig. 1 shows an idealized pipe, one that is frictionless so that the fluid does not stick to the walls. Sticking only to itself (internal viscosity) but not to walls allows a flat velocity profile. (A velocity profile is defined as the map of velocities across a cross section of the pipe.)

Figure 1. Fluid displacement without dispersion, a uniform velocity profile, often called piston flow.
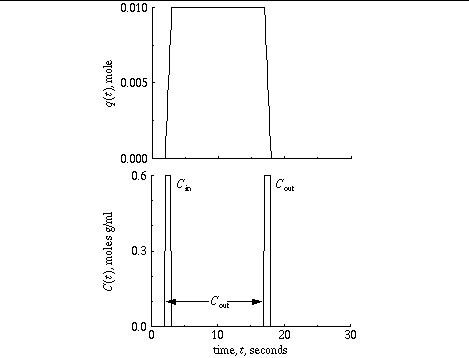
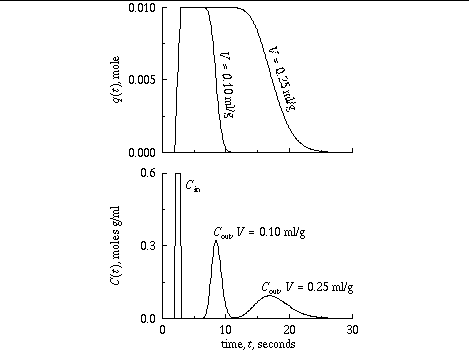
Figure 2. Brief pulse input of 10 mmole in 1.0 second into a pipe. C in is the concentration at the inflow, a pulse beginning at t = 2 s and ending at t = 3 s, and C out is that at the outflow end of the pipe, a pulse beginning at t = 17 s and ending at 18 s. The delay, t0 , is the transit time. The upper panel records the amount of material in the pipe, as if by external detection. F = 0.0167 ml/g/s = 1 ml/g/min , V = 0.25 ml/g, and t = V/F = 15 s.
2. Fluid displacement with dispersion
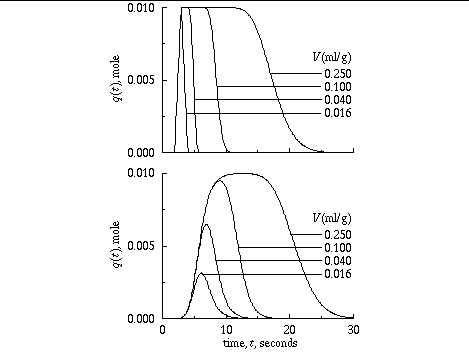
The notation defined originally by Zierler (Meier and Zierler, 1954; Zierler, 1962 and 1965) and formalized by an international agreement (Bassingthwaighte et al., 1986), summarizes what has been represented for transport through an idealized pipe. When the input is the Dirac function, d ( t ), then the system responses are given formal names; these names are completely general. When any other input occurs, the system responses can be defined from the formal descriptors by minor arithmetic manipulations, usually a convolution.

References
Bassingthwaighte, J. B., F. H. Ackerman, and E. H. Wood. Applications of the lagged normal density curve as a model for arterial dilution curves. Circ. Res. 18:398-415, 1966.
Bassingthwaighte, J. B. Physiology and theory of tracer washout techniques for the estimation of myocardial blood flow: Flow estimation from tracer washout. Prog. Cardiovasc. Dis. 20:165-189, 1977.
Bassingthwaighte, J. B., and C. A. Goresky. Modeling in the analysis of solute and water exchange in the microvasculature. In: Handbook of Physiology. Sect. 2, The Cardiovascular System. Vol IV, The Microcirculation , edited by E. M. Renkin and C. C. Michel. Bethesda, MD: Am. Physiol. Soc., 1984, pp. 549-626.
Bassingthwaighte, J. B., F. P. Chinard, C. Crone, C. A. Goresky, N. A. Lassen, R. S. Reneman, and K. L. Zierler. Terminology for mass transport and exchange. Am. J. Physiol. 250 ( Heart Circ. Physiol. 19):H539-H545, 1986.
Bassingthwaighte, J. B., G. R. Raymond, and J. I. S. Chan. Principles of tracer kinetics. In: Nuclear Cardiology: State of the Art and Future Directions , edited by B. L. Zaret and G. A. Beller. St. Louis: Mosby-Year Book, 1993, pp. 3-23.
King, R. B., A. Deussen, G. R. Raymond, and J. B. Bassingthwaighte. A vascular transport operator. Am. J. Physiol. 265 ( Heart Circ. Physiol. 34):H2196-H2208, 1993.
Meier, P., and K. L. Zierler. On the theory of the indicator-dilution method for measurement of blood flow and volume. J. Appl. Physiol. 6:731-744, 1954.
Stephenson, J. L. Theory of the measurement of blood flow by the dilution of an indicator. Bull. Math. Biophys. 10:117-121, 1948.
Zierler, K. L. Circulation times and the theory of indicator-dilution methods for determining blood flow and volume. In: Handbook of Physiology, Sec. 2: Circulation . Washington, D.C.: American Physiological Society, 1962, pp. 585-615.
Zierler, K. L. Theoretical basis of indicator-dilution methods for measuring flow and volume. Circ. Res. 10:393-407, 1962.
Zierler, K. L. Equations for measuring blood flow by external monitoring of radioisotopes. Circ. Res. 16:309-321, 1965.

